
COVID-19 Cognizance
COVID-19 Outbreak has been devastating to the entire world and the available datasets paves way for the general public awareness.
The Motivation
Measuring the impact of the virus in the states and counties would help understand:
- the spread of the coronavirus
- the places most impacted by the virus
- a sense to the measures taken by the states/counties in containing the virus
- the trends from the COVID-19 dataset would also enrich the process of tracking and forecasting the spread of the coronavirus
Data
The data is a global time series of the number of cases and deaths due to COVID-19. It was obtained from the data.world website, and has been sourced from The New York Times, the European Centre for Disease Prevention and Control, and the Public Health Agency of Canada.
Source: https://data.world/covid-19-data-resource-hub/covid-19-case-counts
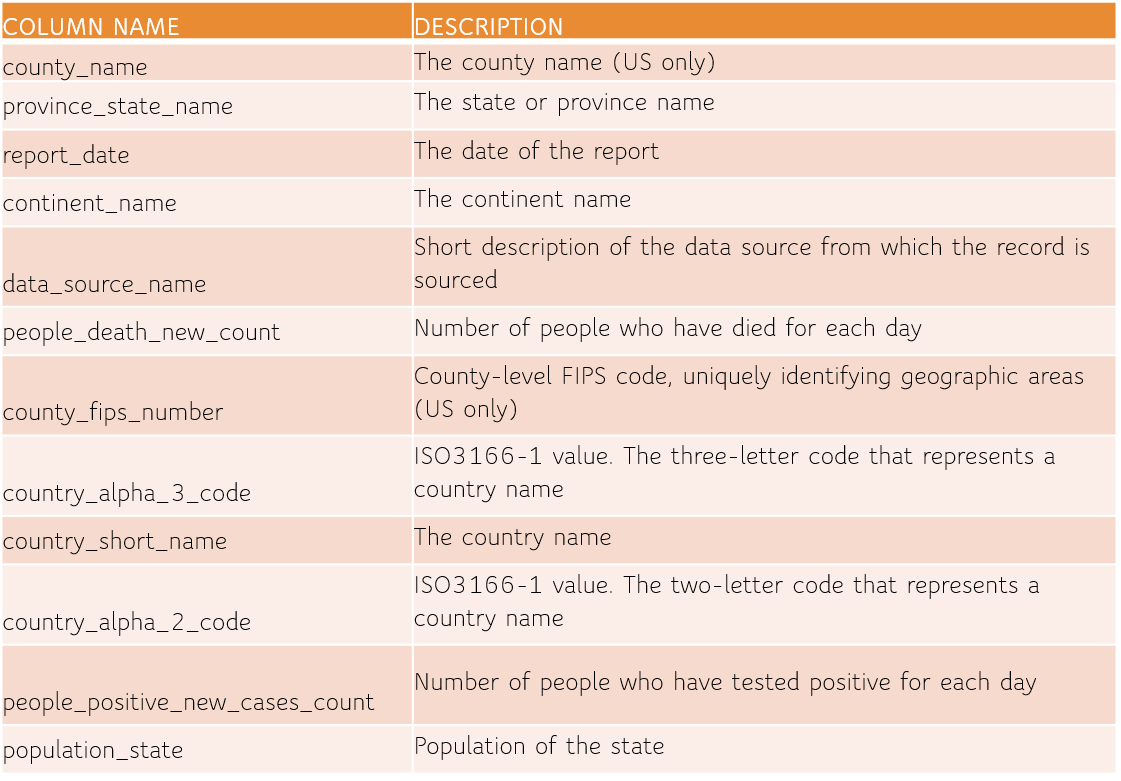
Data Description
The data can be used to formulate and infer various research questions. I have considered
two
research questions to show that analysis on a seemingly simple data,
a time series data, can provide numerous insights using visualizations and can help provide
factual answers to research questions. I have created Tableau Dashboards for the task.
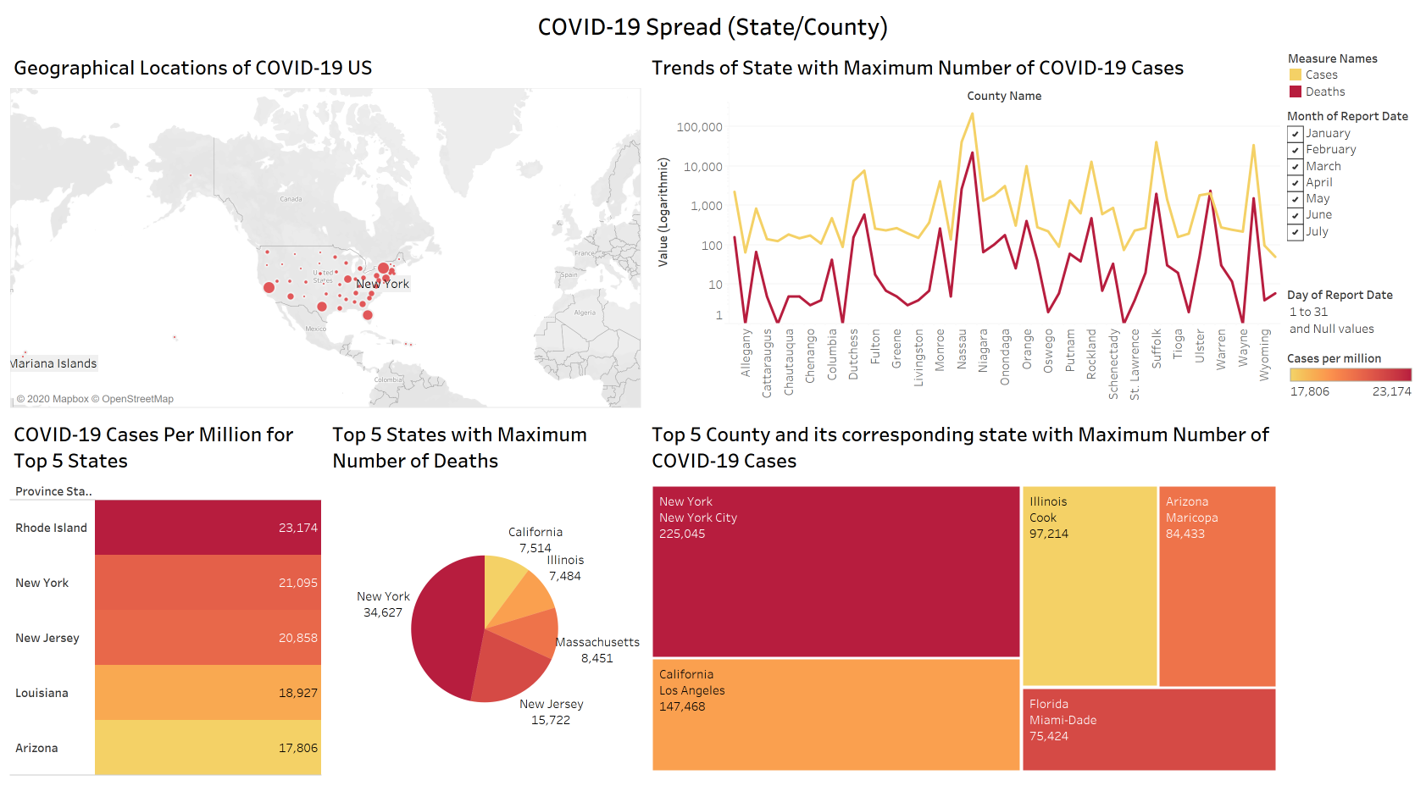
How has the virus affected the counties within the state with maximum number of COVID-19
cases and deaths?
Inference
- New York has the maximum number of cases and deaths.
- Within New York, counties like New York city, Suffolk, Westchester has been most affected by the virus, and counties like Allegany, Delaware have been least affected.
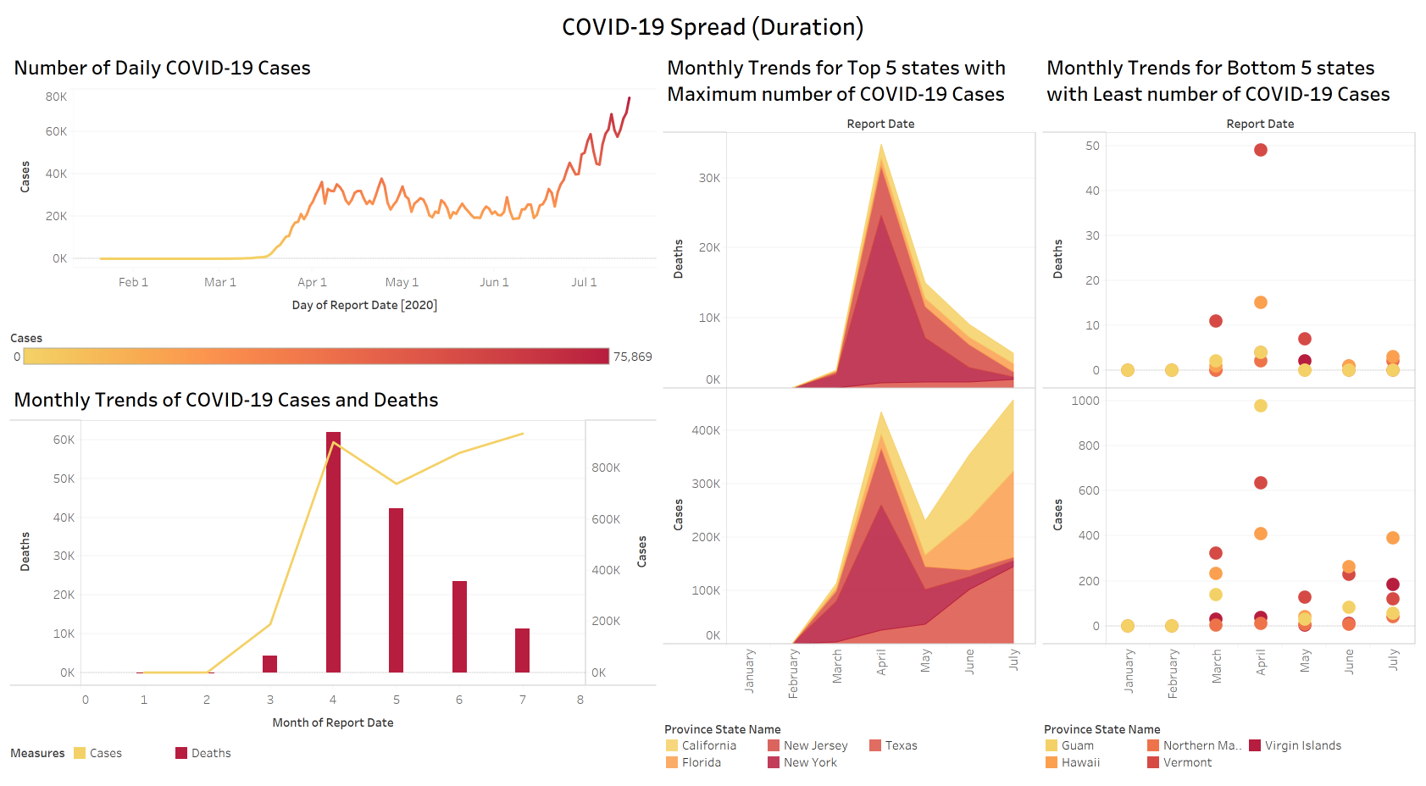
How have the top 5 and bottom 5 states respectively with maximum and least number of
COVID-19 cases performed in terms of number of cases/deaths before the month which
recorded the maximum number of overall COVID-19 cases?
Inference
- July recorded the maximum number of COVID-19 cases (both overall cases and greatest number of cases in a day).
- The top states that have the maximum number of cases are California, New Jersey, Texas, Florida, and New York.
- Analyzing the trends, we can see that the spread of COVID-19 virus was significant in New York in the initial phases but reduced significantly as time progressed. Whereas, California, Florida, Texas have shown an increasing trend in the number of cases over time.
- Moreover, for the states with the least number of COVID-19 cases, Guam and Northern Mariana Islands have managed to keep the virus contained and have certain months with zero deaths.
- Vermont did see a spike in the cases in April, but as of July, has been able to reduce the spread of the virus.
- Hawaii has shown an increasing trend after May, which might be the result of more people travelling to Hawaii for vacations during summer.